Record Highs Back in Focus
- For the week, the Nasdaq was up 1.1% and the S&P added 0.3%. The Dow slipped 0.3% while the Russell gained 1%. Year-to-date, the Nasdaq has jumped 12.4% and the S&P has advanced 10.2%. The Dow is up 6.7% and the Russell has rallied 7%, for 2025.
- The major indexes continue to show impressive gains off the April 7th intraday lows with the Nasdaq and the Russell both surging 39% and leading the surge higher. The S&P has zoomed 35% from its early April low and the Dow has soared 25%.
- The relative strength index (RSI) levels for the major indexes are below 60 and are in a slight downtrend following Friday’s pullback into the closing bell. RSI has been holding 50 for the Nasdaq and the S&P since late April with a little stretch. If there is a sharp move below this level, it could confirm additional selling pressure.
The bulls pushed a fresh round of record highs on Friday despite a disappointing jobs report for the second-straight month. The economy added 22,000 jobs in August, well below expectations for 75,000, while the unemployment rate rose to 4.3% from 4.2%.
The Nasdaq settled at 21,700 (-0.1%) following the afternoon fade to 21,534. Key support at 21,500 held. Undefined resistance is at 22,000.
The S&P 500 tagged a low of 6,443 before ending at 6,481 (-0.3%). Support at 6,450 held. Fresh resistance is at 6,550.
The Dow closed at 45,400 (-0.5%) with the low at 45,211. New support at 45,500 failed to hold. Resistance is at 45,750.
Earnings and Economic News
Before the open: Planet Labs (PL), Toyo (TOYO)
After the close: Casey’s General Stores (CASY), Mama’s Creations (MAMA)
Economic News
Consumer Credit – 3:00pm
Technical Outlook and Market Thoughts
For the week, the Nasdaq was up 1.1% and the S&P added 0.3%. The Dow slipped 0.3% while the Russell gained 1%. Year-to-date, the Nasdaq has jumped 12.4% and the S&P has advanced 10.2%. The Dow is up 6.7% and the Russell has rallied 7%, for 2025.
Tuesday’s pullback to start last week came after a three-day holiday weekend and held key support levels on a dime. The intraday lows for the Nasdaq and the S&P pushed the August 20th bottoms and 50-day moving averages but levels that held into the closing bell.
This was the only chance the bears had at pushing lower lows as the rest of the week was pretty bullish with the aforementioned indexes pushing fresh all-time highs. The blue-chips also tagged a lifetime time while the small-caps hit a new high for 2025.
The major indexes continue to show impressive gains off the April 7th intraday lows with the Nasdaq and the Russell both surging 39% and leading the surge higher. The S&P has zoomed 35% from its early April low and the Dow has soared 25%.
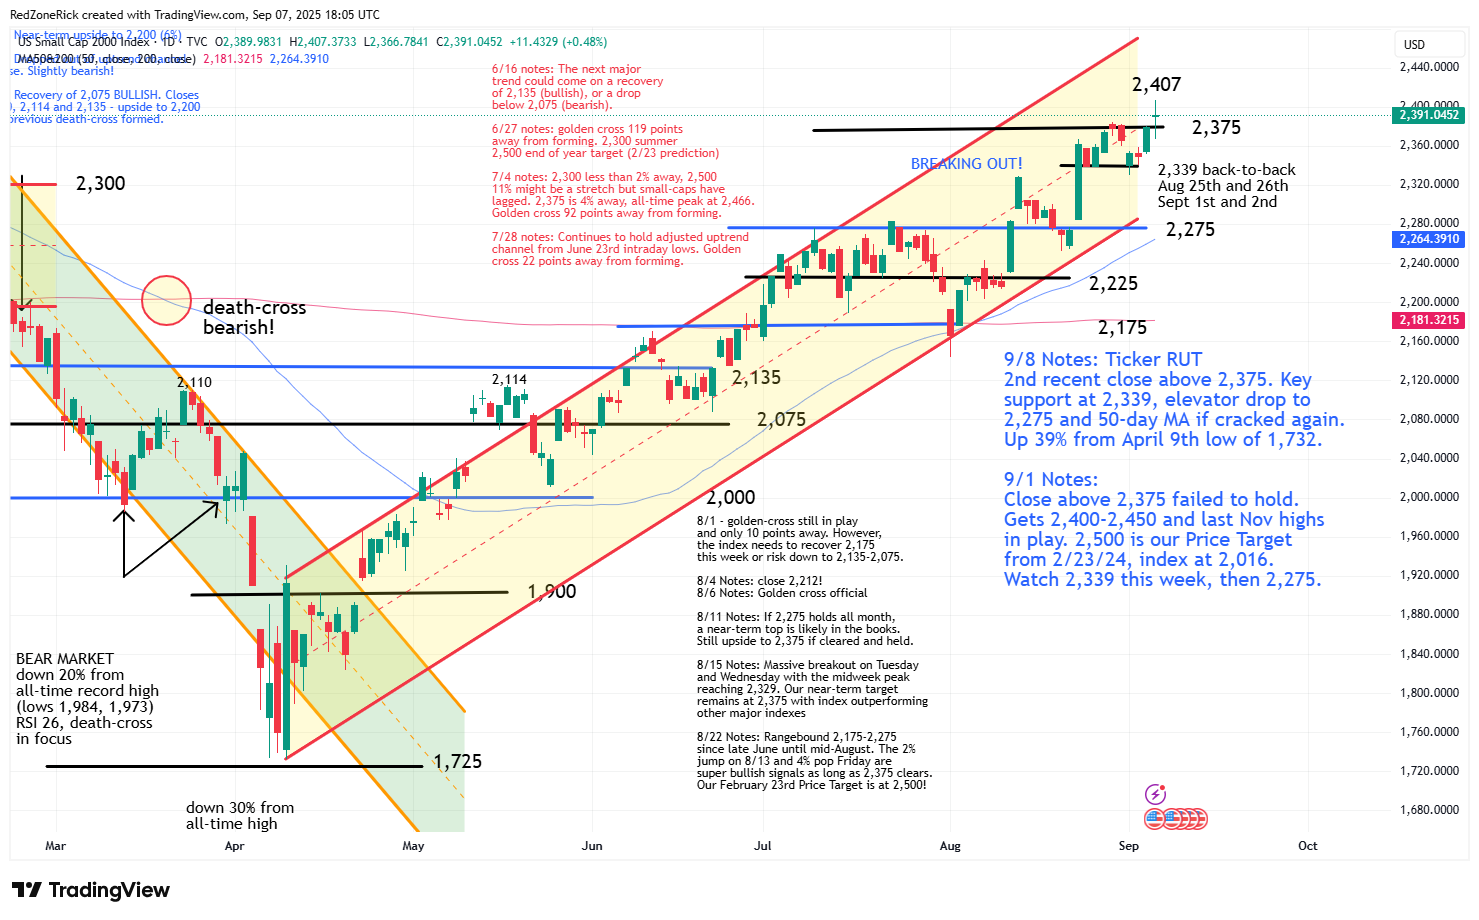
As for the Russell 2000, the index cleared and held key resistance at 2,375 on Thursday with Friday’s high hitting 2,407 and a new 2025 peak. Continued closes above 2,400 gets the all-time high from last November at 2,466 in focus. Our 2025 price target for the index from February 23rd, 2024 is at 2,500 and represents a 24% move from when the index was at 2,016.
Crucial support is at 2,339 and the intraday low from August 25th and 26th. This level held on Tuesday and Wednesday’s weakness with backup help at 2,275. There is stretch down to 2,250-2,225 and the 50-day moving average if 2,275 and the bottom of the current uptrend channel fails to hold.
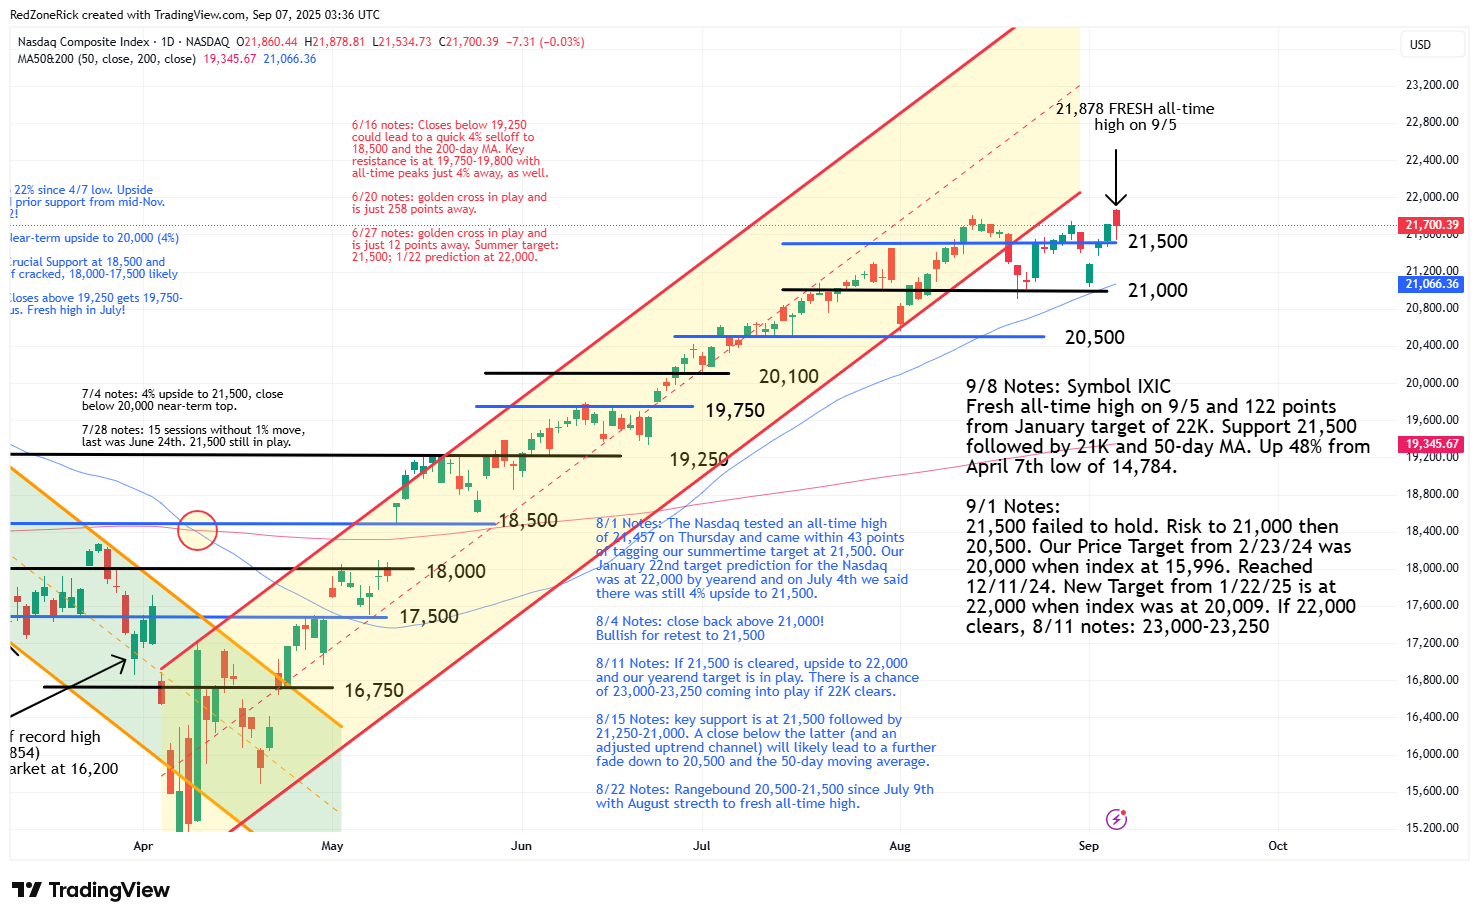
The Nasdaq tagged a lifetime peak of 21,878 on Friday with new and lower resistance at 21,750-22,000 getting cleared but holding. A close above the latter and our updated January 22nd, 2025 price sets up a run to 23,000-23,250. Our previous target for the index had been at 20,000 when the index was at 15,996 on February 23rd, 2024.
Shaky support is at 21,500 followed by 21,000 and the 50-day moving average. A move below the latter two levels would be a slightly bearish signal with weakness towards 20,500.
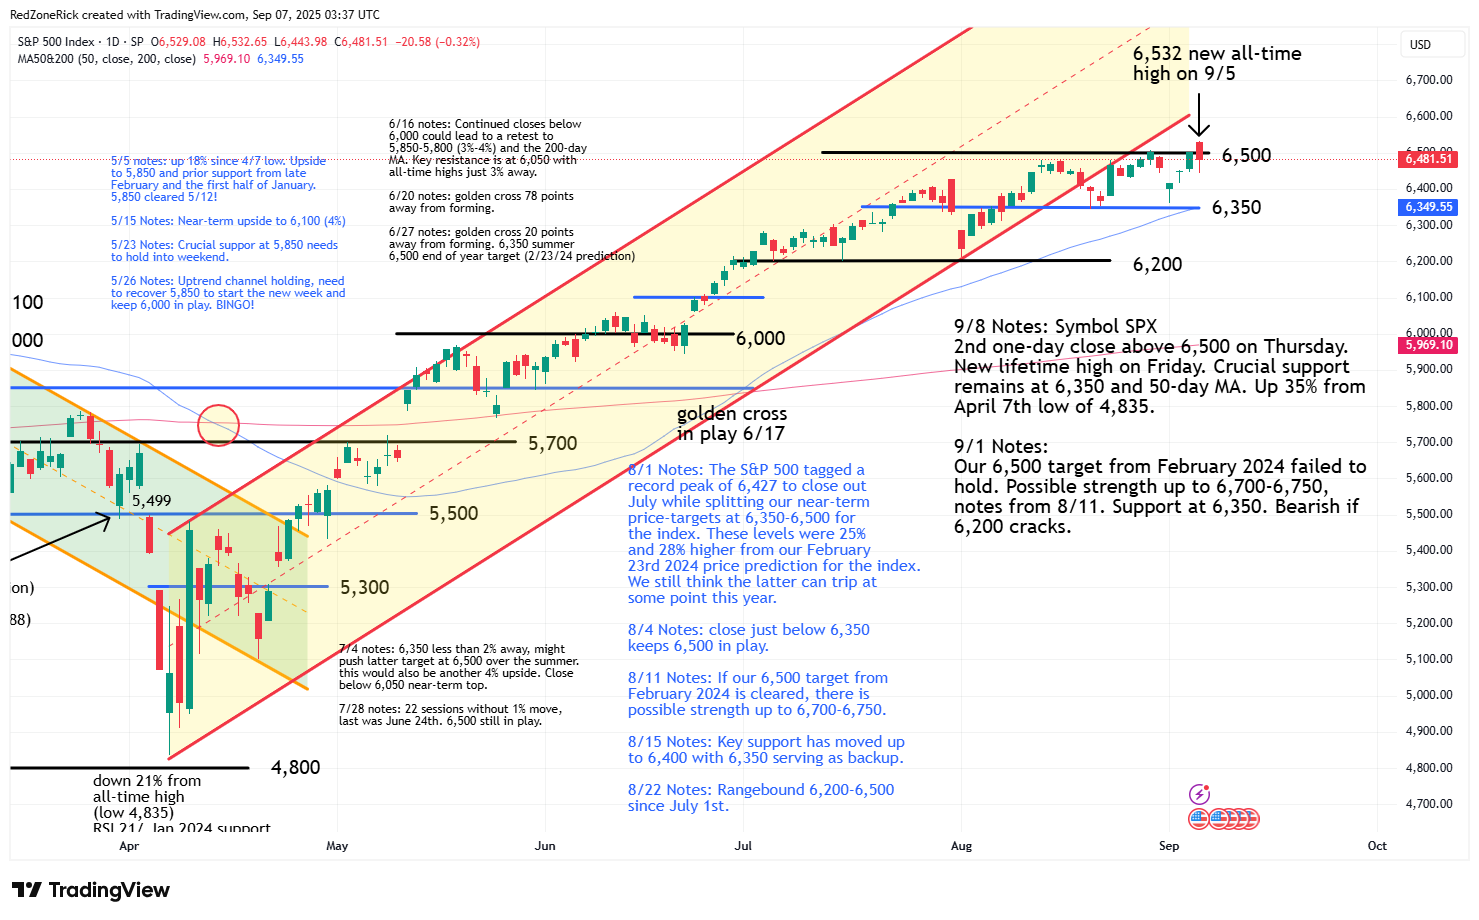
The S&P 500 also set a new record high of 6,532 but failed to hold key resistance at 6,500 and our late February 2024 upper end price target. We said on August 11th that closes above this level would be bullish for ongoing strength towards 6,700-6,750.
Support is at 6,450-6,400. A close below 6,350 and the 50-day moving average would imply a near-term top with retest potential down to 6,200.
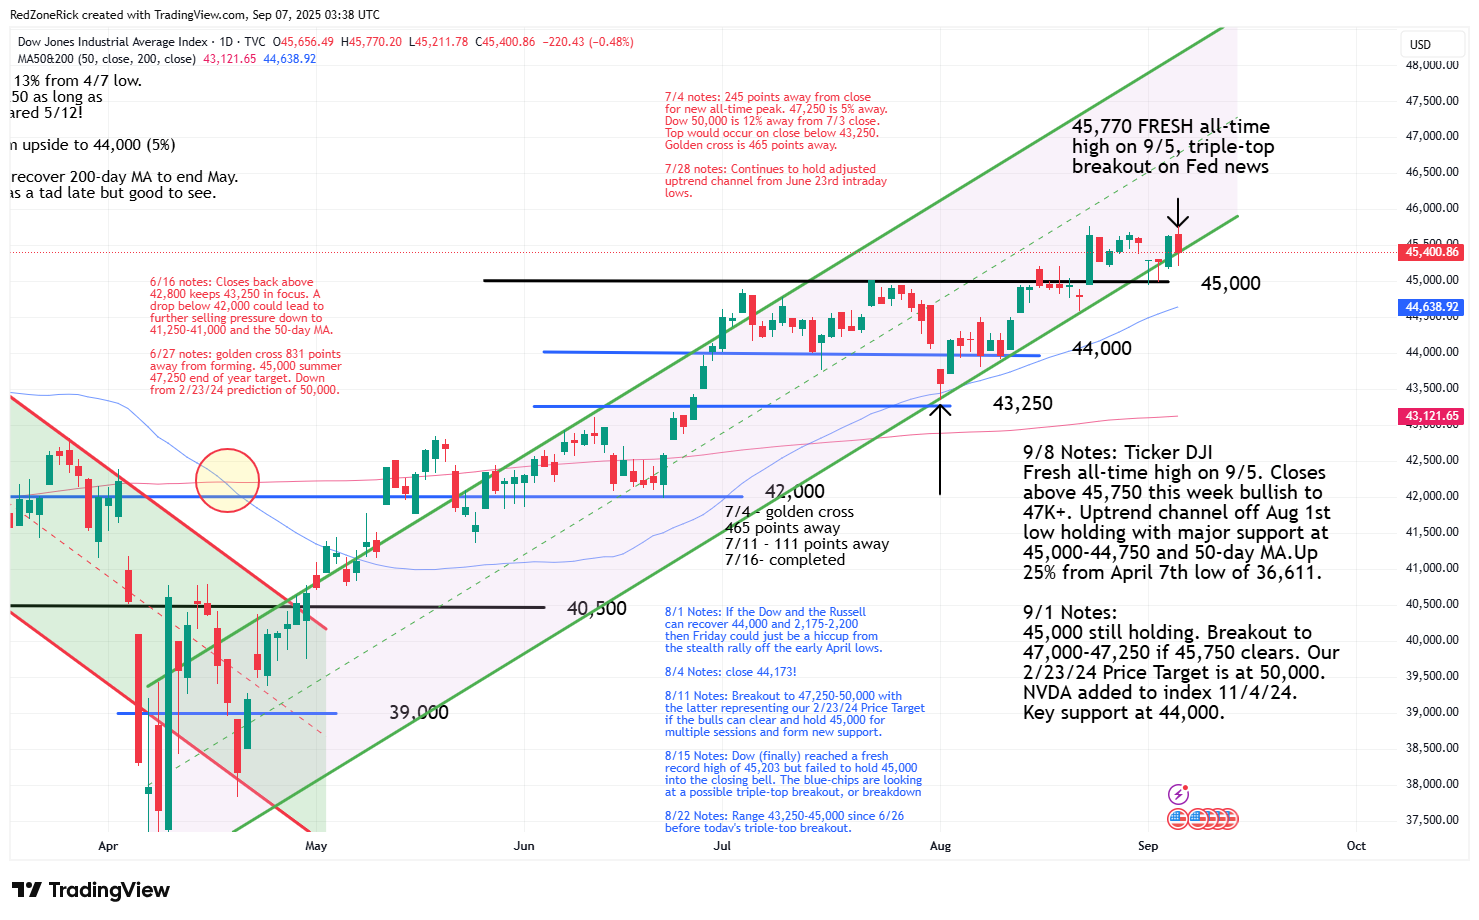
The Dow kissed a record high of 45,770 with current resistance at 45,750 getting topped but holding. Multiple closes above this level could lead to ongoing upside to 47,000-47,250. Our Price Target from February 23rd, 2024 for the blue-chips is at 50,000.
Key support at 45,000 has been holding since the August 22nd breakout above this level. Backup help is at 44,750-44,500 and the 50-day moving average on a close below 45,000 and out of the current uptrend channel. A drop back below 44,000 would imply a near-term top for the blue-chips.
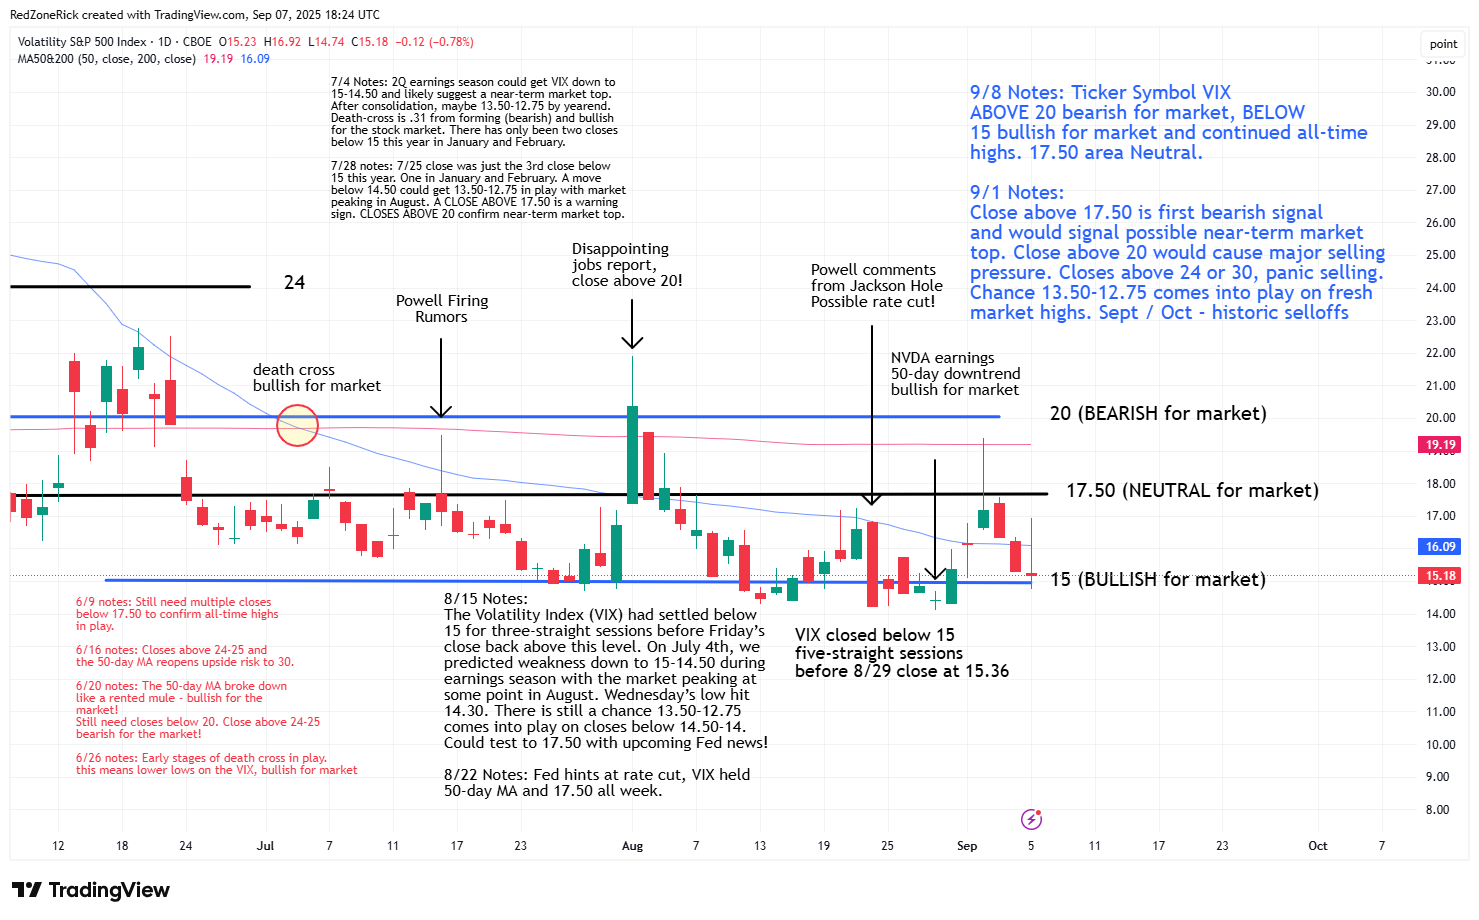
The Volatility Index (VIX) cleared but held key resistance at 17.50 and the 200-day moving average on Tuesday’s market weakness. A close above 20 would be a bearish sign for the bulls and the major indexes.
Support remains at 15-14.50 with Friday’s low at 14.74. There is still a chance 13.50-12.75 comes into play on closes below 14.50-14. Closes below 15 are bullish for the market.
The relative strength index (RSI) levels for the major indexes are below 60 and are in a slight downtrend following Friday’s pullback into the closing bell. RSI has been holding 50 for the Nasdaq and the S&P since late April with a little stretch. If there is a sharp move below this level, it could confirm additional selling pressure.
The regular monthly October options have 39 days before expiration on Monday’s open. The regular monthly November options have 74 days before expiration. We added three new Alerts last week so let’s go check the tape.